In the previous article, I talked about why backend code felt much harder to grok than frontend code. The behavior was spread across more places, the data journey was harder to follow, and a useful change often required understanding several systems at once.
The way I’ve adapted is to treat a backend as a system of systems. I look for cohesive boundaries, identify their inputs and outputs, and trace how they connect. When that gets difficult to hold in my head, I literally write it down and graph it out.
I suspect the best backend engineers can produce these abstractions and assemble a useful system diagram in their heads very quickly. That may be an important part of their speed, especially when onboarding to a complex backend.
Identify the inputs and outputs
The input-output idea is as obvious as it sounds. When I’m reading a piece of the backend, I try to understand it as a black box: what goes in, what happens at its boundary, and what comes out? Those outputs include side effects. Writing to a database or putting work on a queue matters just as much to this model as a return value.
For example, say an API request creates a database row and queues a job. The job performs a scan, then saves the scan results by updating the row the API created. Another API reads that row, combines it with a second data model, and returns the data.
Each piece gives me a boundary to understand. The first API takes a request and produces a row and queued work. The job takes that work, performs the scan, and updates the row with the results. The read API takes a request, reads two models, and produces a response.
Trace the data journey
But understanding those pieces individually only gets me part of the way there. I also need to understand the data journey: how the row starts out, how the job changes it, and how those results reach the later API response. That’s where the system diagram becomes useful.
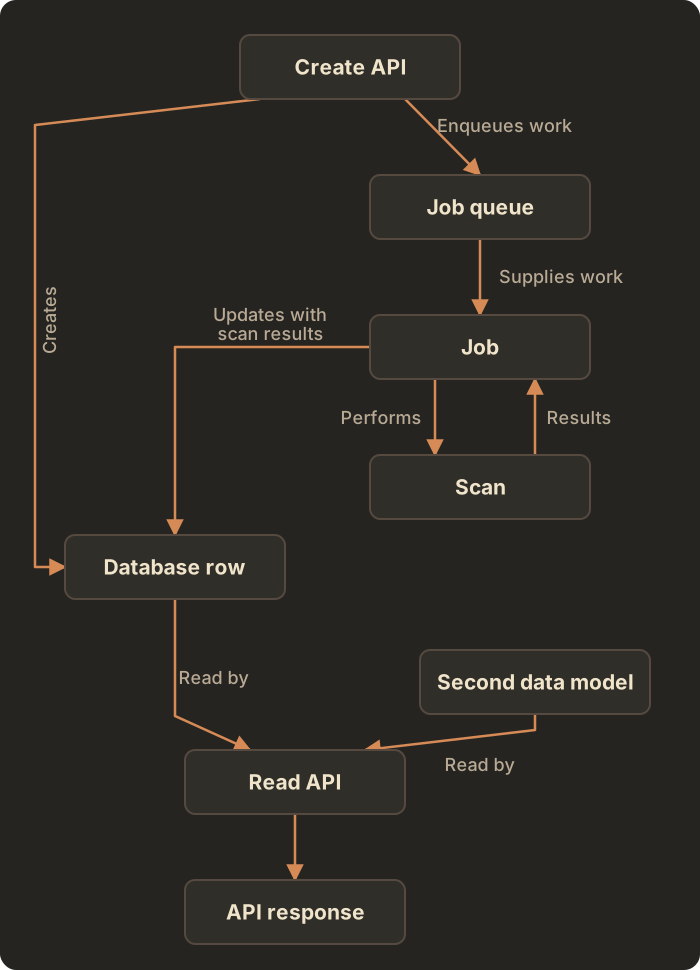
Mermaid source
flowchart TD
    create[Create API] -->|Creates| row[Database row]
    create -->|Enqueues work| queue[Job queue]
    queue -->|Supplies work| job[Job]
    job -->|Performs| scan[Scan]
    scan -->|Results| job
    job -->|Updates with scan results| row
    row -->|Read by| read[Read API]
    other[Second data model] -->|Read by| read
    read --> response[API response]
I find myself doing this much more often in backend code than I did in frontend code. I’ll be reading through the system, finding the next piece of behavior, and adding it to my notes or chart. Otherwise, it’s easy to understand the function in front of me and lose track of how it fits into the larger sequence.
Understand the surrounding systems
Then there’s all the surrounding machinery. An auth system determines who can call those APIs and what data they can read. An auditing system might be watching changes through behavior that isn’t obvious in the endpoint. Instrumentation collects monitoring data and metrics. Logging gives me another part of the system to understand.
I also need to understand the data models and how the ORM reads and writes them. Depending on the work, scaling concerns can matter too. A simple-looking feature can require knowledge of quite a lot of underlying stuff before I can get it out the door.
Those systems belong in my understanding alongside the main data journey. If auth determines whether the read can happen, or auditing reacts to the database update, that’s behavior I need to account for. The API, job, and database diagram gives me a starting point, and I build out the picture as I encounter those connections.
How far to open each black box is a question of taste. Knowing its inputs and outputs may be enough for some work; other changes require understanding what’s happening inside. I don’t have a precise rule for that. It’s judgment you develop.
In my experience, the complexity floor is often much higher in a backend. This is how I approach that: identify the pieces, make their inputs and outputs explicit, and connect them into a picture of the data journey. If that picture is getting hard to hold in my head, I’d draw it.